In March of 2016, as part of its “Consumer Intelligence Series“, PricewaterhouseCoopers (“PwC”) conducted a study that resulted in this report: The Wearable Life 2.0 Connected living in a wearable world.

It’s Awesome.
Right off the bat, the report had this to say:

“Health: primary motivator
Fitness wearables paved the way for wearable technology’s popularity today. Case in point: the wearable section (made up of mostly fitness devices) occupied just a few hundred square feet at the 2014 Consumer Electronic Show (CES) in Las Vegas. By 2015, the two categories had consolidated, occupying both the Sands Expo and Convention Center in Las Vegas. [Engadget, “2015 is the year that wearables begin to grow up, January 10, 2015].
By January 2016, the exhibit had tripled, taking center stage. [PR Newswire, “The Multi-Billion Dollar Wearable Tech Sector Headlines CES 2016,” November 25, 2015]”
But Most Importantly
The report confirmed what I reported after Day 1 of CES [Tech Talk Translated, “CES 2016: Day 1 – Tech West,” January 7, 2016]:“Our survey echoed this pattern, with the majority of adoption taking place within the past year. And while this, too, held true for fitness devices, their head start has paid off—more of them were purchased over a year ago than any other type of device.”
In my post, I had noted “that there was a very apparent (and as far as I’m concerned, welcome) shift in the wearable market from the fitness trackers of CES 2015 to the healthcare trackers of CES 2016.” But yes, there were also significantly more wearables in 2016 than in 2015.
- Gauge current usage, perceptions, attitudes, key drivers, and satisfaction of wearable technology and how various factors have changed since 2014
- From the users’ point of view, has anything changed since 2014?

- Identify key benefits and barriers to using wearable technology
- What are the pros & cons to using wearable tech?
- Understand how wearable technology is impacting individuals and society
- Consider this one the “what affect is wearable technology having on my life, be it personal, professional, etc”

how strongly the following would impact your usage of wearable technology, if at all.
- Assess concerns around data and privacy with wearable technology
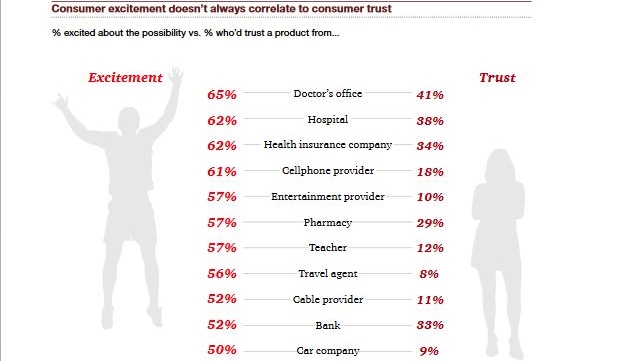
- You know, what I do all day 🙂 The “trust” graphic above sort of applies, but sadly the report found that “concerns around privacy have actually lessened since 2014 for two out of the four product categories (smart watches and glasses)” and that “Price—not privacy—is the biggest hurdle to adoption.” 😦
- You know, what I do all day 🙂 The “trust” graphic above sort of applies, but sadly the report found that “concerns around privacy have actually lessened since 2014 for two out of the four product categories (smart watches and glasses)” and that “Price—not privacy—is the biggest hurdle to adoption.” 😦
- Uncover potential white space opportunities and applications for wearable technology
- “white space” = (in this context anyway) “not already taken”. So, essentially, they wanted to know whether or not all of the possible uses for wearables had already been identified. Spoiler alert= there are things left to invent!